고정 헤더 영역
상세 컨텐츠
본문
Logistic Regression
*Characteristics
◼ Logistic Regression은 정규 선형 회귀 분석의 변형이다.
◼ Logistic Regression은 종속 변수가 이항(1 또는 0)인 데이터에 곡선을 적합시키는 데 사용된다.
◼ 독립 변수 Xi 집합과 이분법 범주형 종속 변수 Y 사이의 관계를 모델링한다.
◼ Linear Regression과 달리 Logistic Regression에서는 독립 변수와 종속 변수의 관계가 선형이라고 가정하지 않는다.
◼ 종속 변수나 오차항이 정규 분포를 따른다고 가정하지 않는다.
◼ Logistic Regression에서 Binary Logistic Model은 하나 이상의 독립 변수를 기반으로 이항 반응의 확률을 추정하는 데 사용된다.
*Introducing Logit
테스토스테론 수준과 대출 연체에 대한 연구에서 나온 다음의 데이터를 사용해서 odds, odds ratio를 계산해보겠다.

-Probability: 사건의 확률 p는 많은 시행에서 사건이 발생하는 횟수의 백분율
-Odds: 사건이 발생할 확률을 사건이 발생하지 않을 확률로 나눈 값 [ p/(1-p) ]
odds of being delinquent if you are in the Normal testosterone group:
(402/4016) / (1 - (402/4016)) = 0.1001 / 0.8889 = 0.111
odds of being not delinquent in the Normal testosterone group:
0.8999/0.1001 = 8.99
odds of being delinquent in the High testosterone group:
101/345 = 0.293
odds of being not delinquent in the High testosterone group:
345/101 = 3.416
-Odds Ratio: 두 odds 사이의 비율 [ odds1/odds2 ]
0.293/0.111 = 2.64
2.64 times more likely to be delinquent with high testosterone levels
-Logit: odds의 자연 로그 [ ln(p/(1-p)) ]
Math Behind Logistic Regression
*Logistic Regression

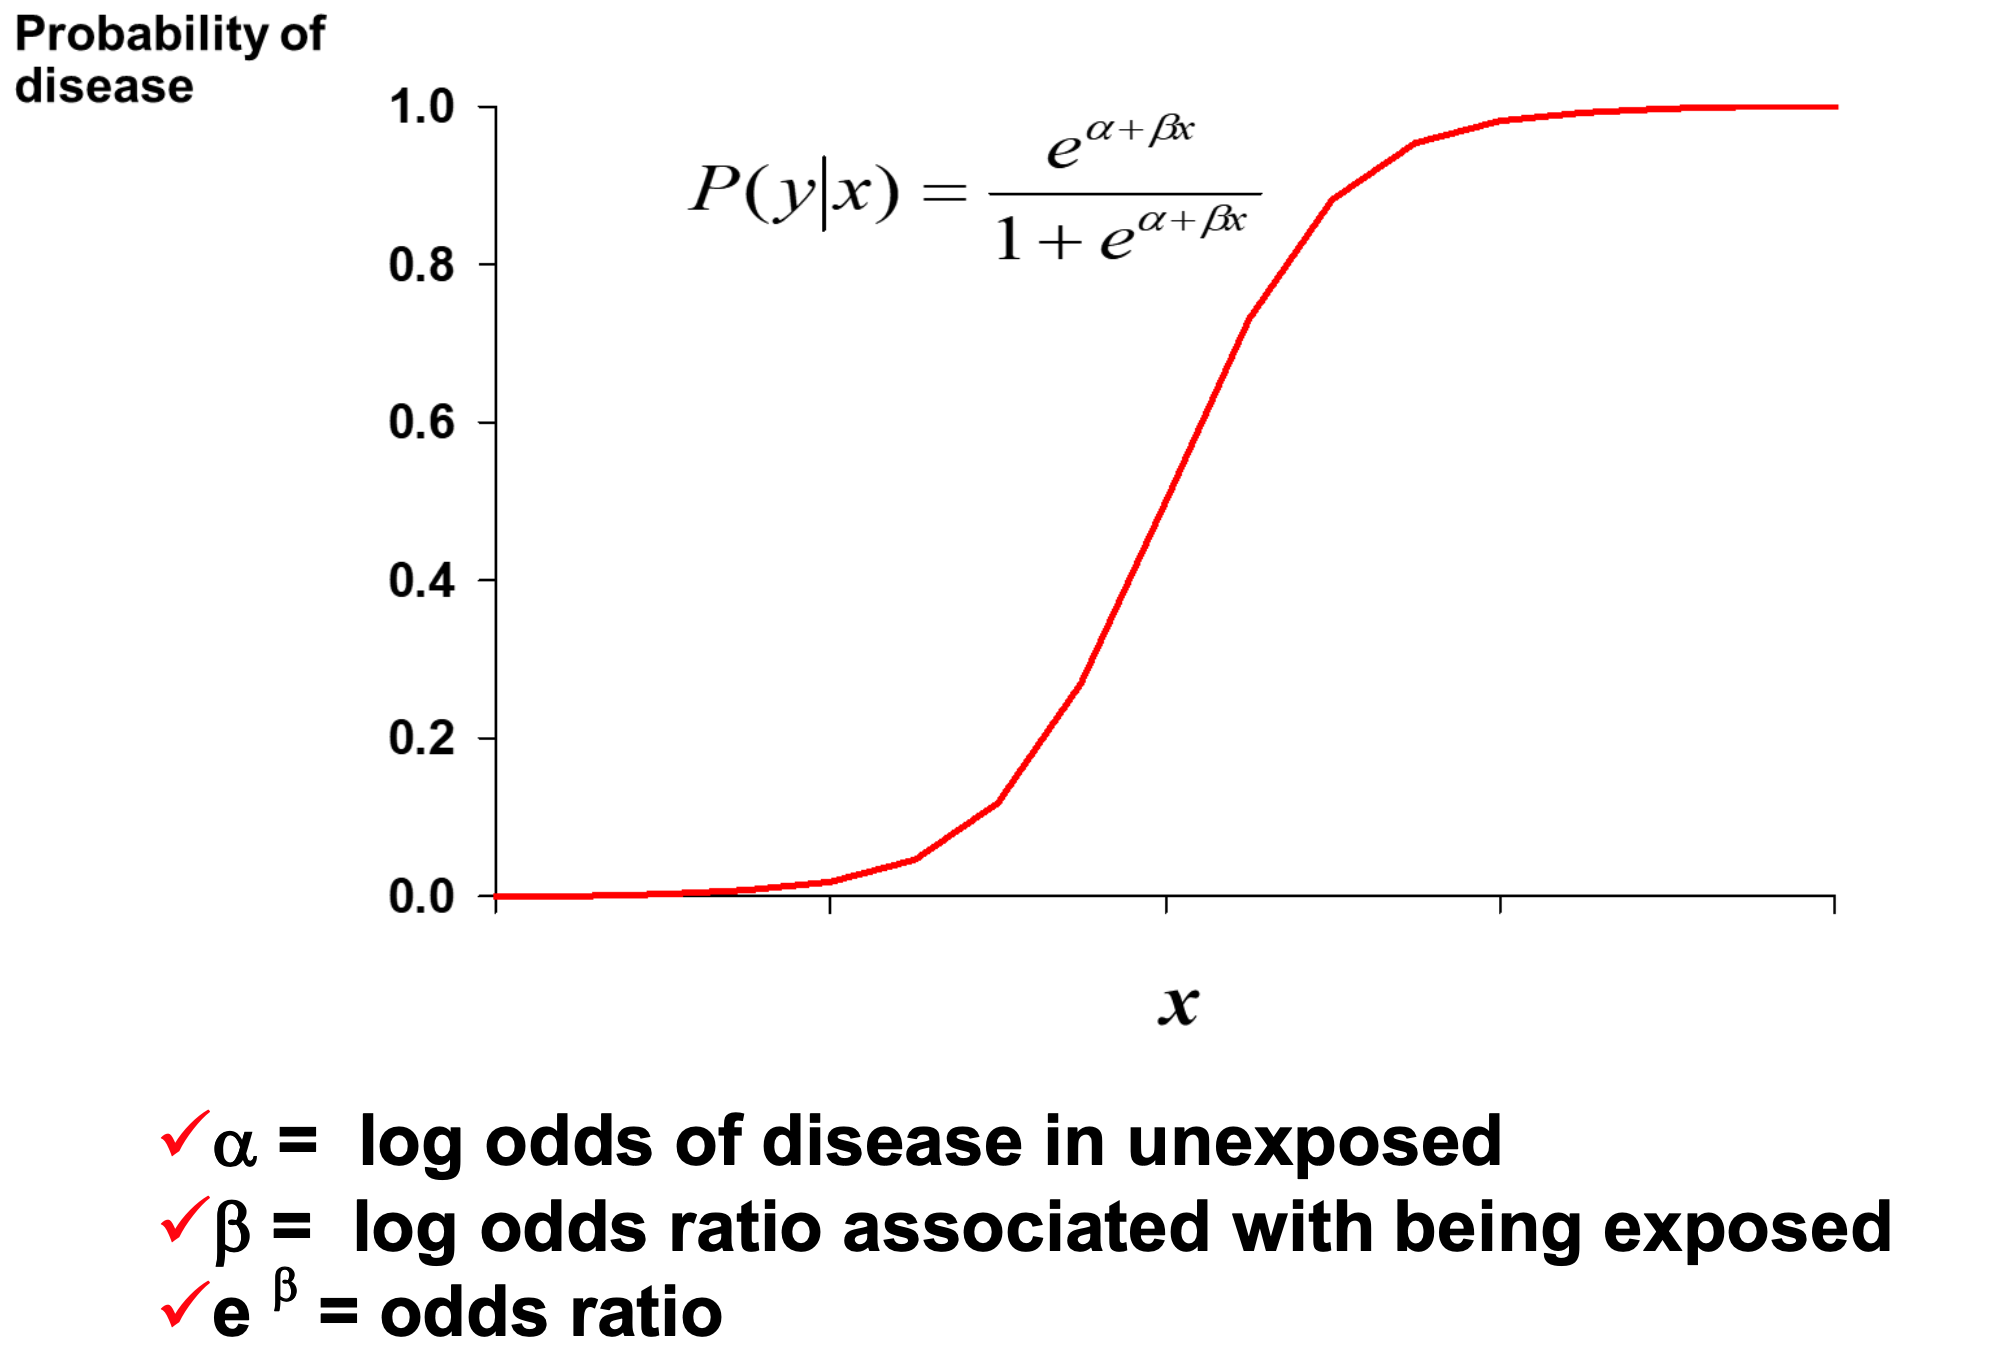
log odds(=logit)는 독립 변수 X와 선형적으로 관련된 것으로 가정된다.
*Logistic Funcition

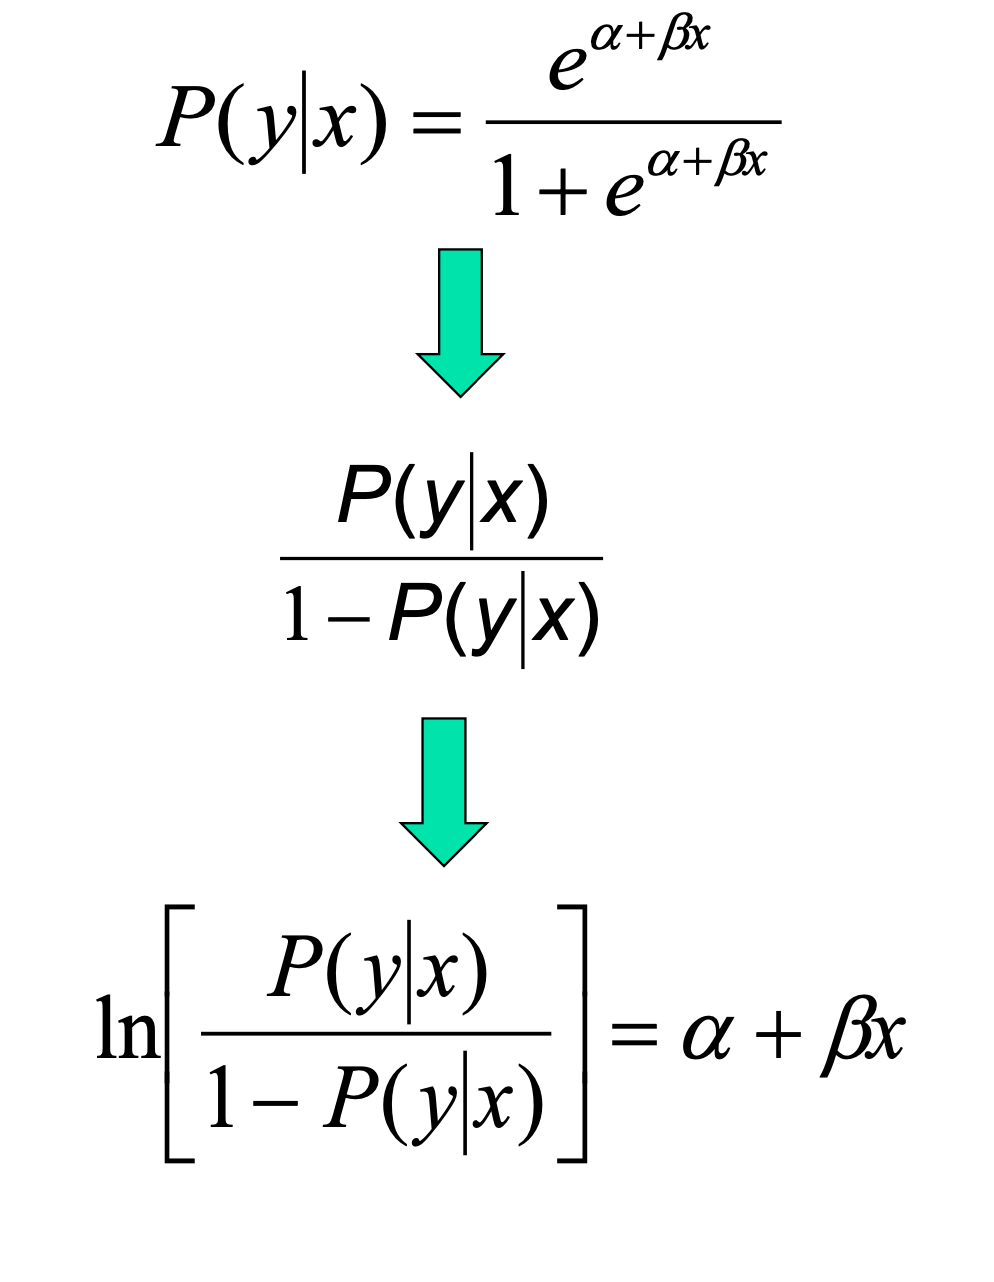
*Transformation(probability -> odds -> logistic regression)

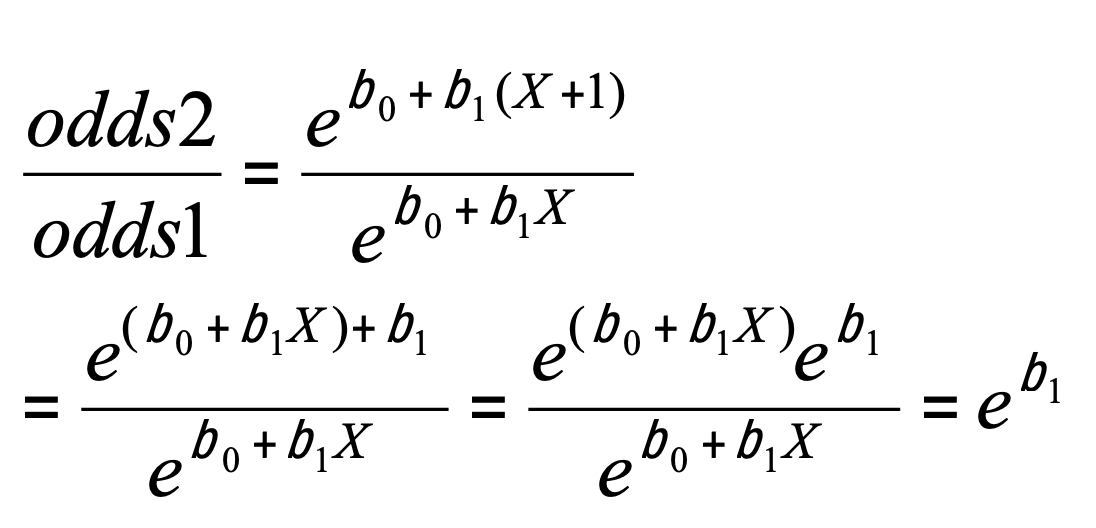
*interpretation of beta
odds1 = odds for value X (p/(1–p))
odds2 = odds for value X + 1 unit
이라고 하면,

따라서 기울기의 지수(e^b1)는 예측 odds ratio가 X의 각 단위에 따라 변하는 속도를 나타낸다.
*Logistic Regression Using Sckit Learn
# Load the dataset
from sklearn.datasets import fetch_mldata mnist = fetch_mldata('MNIST original')

# Split the dataset into training and testing set
test_size=1/7.0
#training set size 60,000 images and the test set size of 10,000
from sklearn.model_selection import train_test_split train_img, test_img, train_lbl, test_lbl =
	train_test_split(mnist.data, mnist.target, test_size=1/7.0, random_state=0)

# Import the model
from sklearn.linear_model import LogisticRegression

# Make an instance of the model
# all parameters not specified are set to their defaults
# use Broyden-Fletcher-Goldfarb-Shanno
logisticRegr = LogisticRegression(solver = 'lbfgs')

# Train the model
logisticRegr.fit(train_img, train_lbl)

# Predict using the model
# Returns a NumPy Array
# Predict for one observation (image)
logisticRegr.predict(test_img[0].reshape(1,-1))

# Predict multiple observations (images)
logisticRegr.predict(test_img[0:10])

# Predict on entire dataset
predictions = logisticRegr.predict(test_img)

# Measure accuracy
# Use the score method to get the accuracy of model
score = logisticRegr.score(test_img, test_lbl) print(score)
'machine learning' 카테고리의 다른 글
| [ML] Clustering Algorithms –Expectation-Maximization (Gaussian Mixture Model) (0) | 2022.12.15 |
|---|---|
| [ML] Clustering Algorithms – Partitioning (0) | 2022.12.15 |
| [ML] Clustering Algorithms – Clustering Quality Measure (2) | 2022.12.14 |
| [ML] Classification Algorithms – Support Vector Machine (0) | 2022.12.13 |
| [ML] Classification Algorithms –Decision Trees (2) | 2022.12.12 |


댓글 영역