고정 헤더 영역
상세 컨텐츠
본문
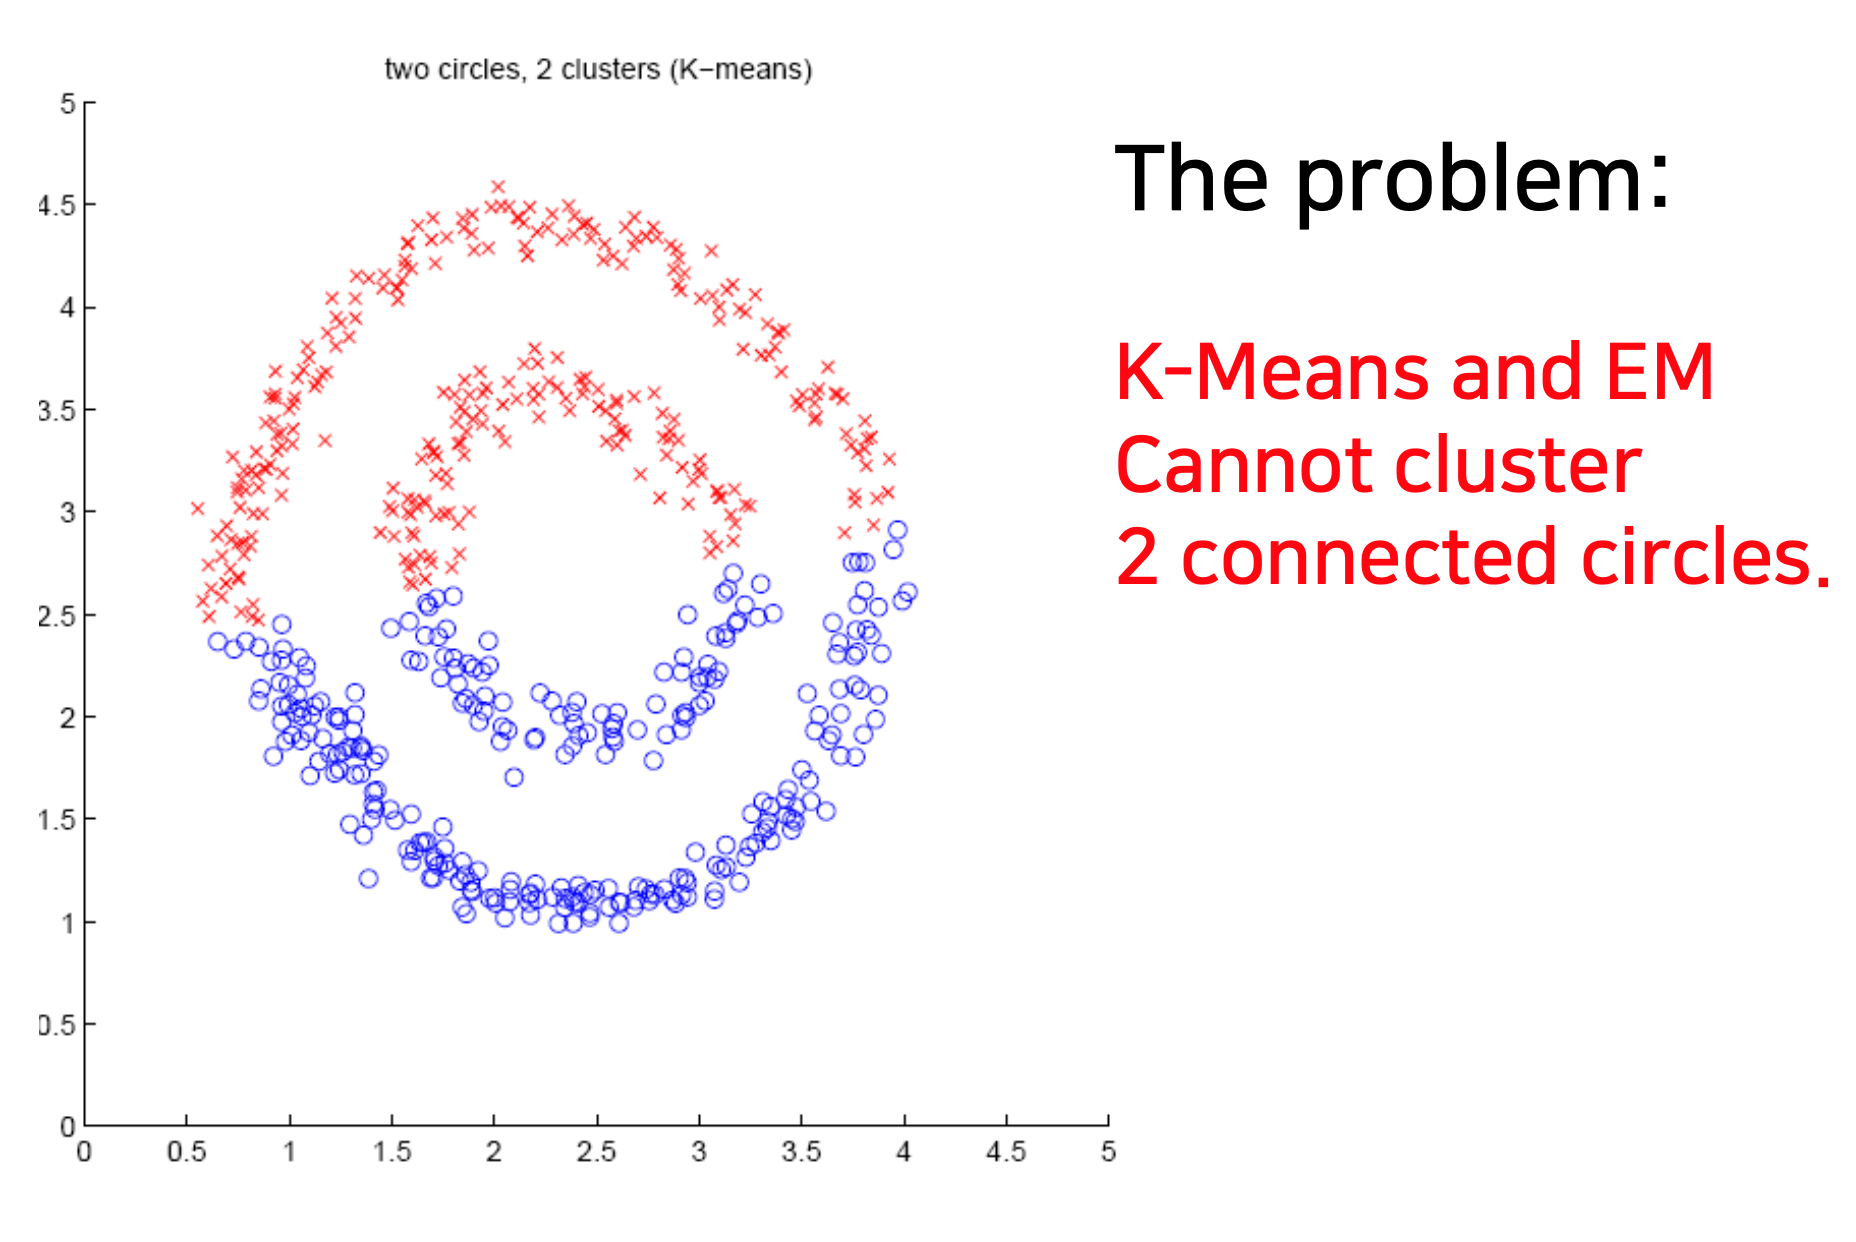
- Clustering Challenges and Solution
K-means 및 EM Clustering은 모든 클러스터링 작업(e.g. non-Gaussian data)을 처리할 수는 없다.

=> Density-based clustering, spectral clustering은 이러한 유형의 문제를 해결한다.

Density-Based Clustering Methods
density-connected points 또는 density function와 같은 밀도 기반 클러스터링(로컬 클러스터 기준)
◼ 클러스터는 데이터 공간에서 개체 밀도가 낮은 영역으로 분리된 밀집된 개체 영역이다.
◼ 한 군집에 있는 점 집합은 공간적으로 연결되어 있다.
◼ 클러스터의 모든 점에 대해 해당 점 주변의 로컬 점 밀도가 일부 임계값을 초과해야 한다.
◼ 점 p에서의 국소 점 밀도는 아래의 두 개의 파라미터로 정의된다.


DBSCAN (= Density-Based Spatial Clustering of Applications with Noise)
-Terms
◼ density: π-근접 내의 점 개수
◼ core point: 근린 내에 MinPts 객체가 더 많은 경우
◼ border point: Eps 내에서 MinPts 객체보다 적지만 core point 근처에 있는 경우
◼ noise point: core point 또는 border point가 아닌 모든 포인트

-DBSCAN Algorithm
◼ 임의의 데이터 점 p를 첫 번째 점으로 선택
◼ 이웃에 있는 모든 점을 추출(점에서 최대 eps 거리)
◼ len(수치) >= minPts인 경우,
a. p를 새 클러스터의 첫 번째 점으로 간주
b. eps 거리 내의 모든 점 고려
c. 모든 점에 대해 b단계를 반복
◼ 그렇지 않으면 p를 노이즈로 레이블 지정
◼ 전체 데이터 세트에 레이블이 지정될 때까지 위의 단계를 반복
-Complexity of DBSCAN
◼ 시간 복잡성: O(n^2)
◼ 공간 복잡성: O(n)
-Advantages of DBSCAN
◼ 소음에 강하다.
◼ 다양한 모양과 크기의 클러스터를 처리할 수 있다.
◼ 군집은 임의의 모양과 크기를 가질 수 있다.
◼ 클러스터 수는 자동으로 결정된다.
◼ 주변 소음으로부터 클러스터를 분리할 수 있다.

-Disadvantages of DBSCAN
◼ 입력 매개 변수를 확인하기 어려울 수 있다.
◼ 일부 상황에서는 입력 매개 변수 설정에 매우 민감하다.
-Scikit Learn Support for DBSCAN
# Import the required libraries
import numpy as np
import pandas as pd
import matplotlib.pyplot as plt
from sklearn.cluster import DBSCAN
from sklearn.preprocessing import StandardScaler
from sklearn.preprocessing import normalize
from sklearn.decomposition import PCA

# Load the data
X = pd.read_csv('..input_path/CC_GENERAL.csv')

# Drop the CUST_ID column from the data
X = X.drop('CUST_ID', axis = 1)

# Handle the missing values
X.fillna(method ='ffill', inplace = True)

# Preprocess the data
# Scale the data to bring all the attributes to a comparable level
scaler eStandardScaler()
X_scaled = scaler.fit_transform(X)

# Normalize the data so that
# the data approximately follows a Gaussian distribution
X_normalized = normalize(X_scaled)

# Convert the numpy array into a pandas DataFrame
X_normalized = pd.DataFrame(X_normalized)

# Reduce the dimensionality of the data to make it visualizable
pca = PCA(n_components = 2)
X_principal = pca.fit_transform(X_normalized)
X_principal = pd.DataFrame(X_principal)
X_principal.columns = ['P1', 'P2']
print(X_principal.head())

# Build the clustering model
# Numpy array of all the cluster labels assigned to each
# data point
db_default = DBSCAN(eps = 0.0375, min_samples = 3).fit(X_principal)
labels = db_default.labels
'machine learning' 카테고리의 다른 글
| [ML] Cost Function Optimization - Regularization (0) | 2022.12.17 |
|---|---|
| [ML] Classification - SMOTE (0) | 2022.12.16 |
| [ML] Clustering Algorithms –Expectation-Maximization (Gaussian Mixture Model) (0) | 2022.12.15 |
| [ML] Clustering Algorithms – Partitioning (0) | 2022.12.15 |
| [ML] Clustering Algorithms – Clustering Quality Measure (2) | 2022.12.14 |


댓글 영역